User-centric performance metrics
I’ve been focused on performance for several days now, so I’d like to share some knowledge. What exactly do we mean when we say a website is fast? What’s the definition of “fast”? And when we say it’s fast, what are we using to measure that? Today, let’s understand this together.
Before we delve into Core Web Vitals, which involves using these metrics to improve our website, we need to first understand user-centric performance metrics. This is because the Core Web Vitals, which I’ll write about in the next blog post, use these user-centric performance metrics as measurement tools.
Let’s look at this scenario
- A website might be fast for one user (on a fast network and high-performance device) but slow for another user (on a slow network and low-end device)
- Two websites might take the same time to finish loading, but one may seem to load faster (if it loads content gradually instead of waiting until everything is loaded before displaying)
- A website might appear to load quickly, but then respond slowly (or not at all) to user interactions
“Performance” or “speed of operation” is not something that can be generally evaluated as good or bad, because performance depends on various conditions or situations, such as the user’s environment or the device used, which can make each user’s experience different. In some cases, what seems to work well for one person may not work well for another. All of this shows that performance is not fixed and consistent for everyone, but changes according to different contexts.
Defining Metric Mmeasurement
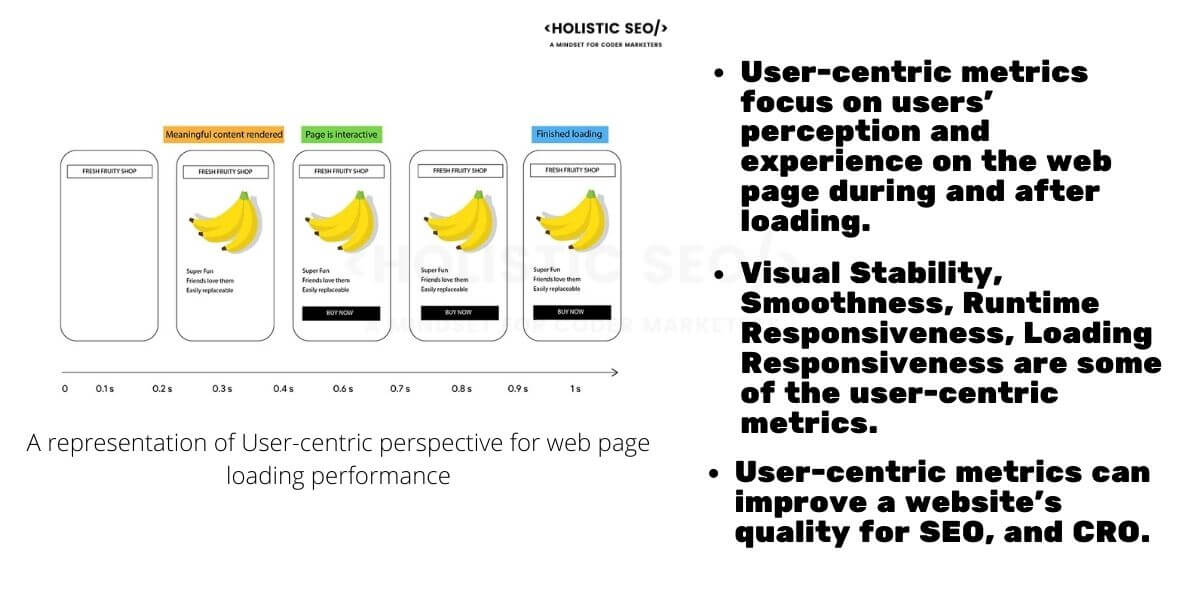
In the past, we used to measure a website primarily by its page load time. However, sometimes that’s not really the part that users like us care about much.
For example, my website loads very quickly, but some important text still needs to be fetched from an API. You’ll see that even though it loads fast initially, some parts - the parts that users really want to see - still take several seconds to load.
These four questions are ones we should consider when starting to improve website performance. These questions come from Philip Walton and are used by the Chrome team, as well as the W3C Web Performance Working Group, to develop standard APIs for measuring web performance from the user’s perspective.
- Is it happening? - Has the navigation started successfully? Has the server responded yet?
- Is it useful? - Has enough content loaded for users to engage with?
- Is it usable? - Can users interact with the page, or is it still loading or processing?
- Is it delightful? - Are the interactions with the website smooth or are there still delays?

The origin of these four questions above
- Philip Walton is a developer and researcher who has contributed to the development of web standards and tools related to website performance.
- The four questions mentioned in the article about measuring website performance have actually been used in the work of the W3C Web Performance Working Group to create standards and APIs used to measure performance from the user’s perspective.
- The Chrome team, including Philip Walton and related groups, has used these questions in developing standards and tools that help accurately and consistently measure web performance.
The four questions mentioned (Is it happening, Is it useful, Is it usable, Is it delightful) are based on the work of Philip Walton and related groups, which is part of the effort to improve methods of measuring web performance to better reflect user experience.

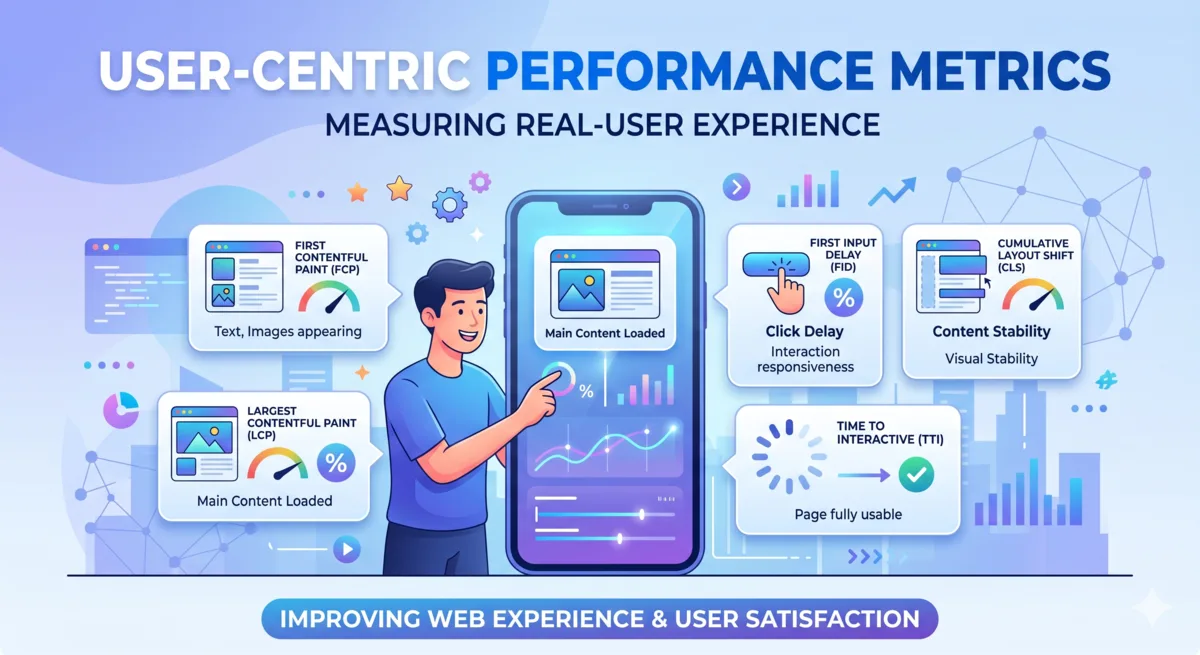
Important metrics to measure
From all that has been discussed, the key and popular metrics, which are included in Google’s tools, are all metrics that should be used to initially evaluate our website’s performance. However, there are other metrics that may not be mentioned here.
- First Contentful Paint (FCP): Measures the time from when the page starts loading to when any part of the page’s content is rendered on the screen
- Largest Contentful Paint (LCP): Measures the time from when the page starts loading to when the largest text block or image is rendered on the screen
- Interaction to Next Paint (INP): Measures the latency of all taps, clicks, or keyboard interactions that occur on a page (depending on the number of interactions) and selects the worst (or closest to worst) latency as a single value
- Total Blocking Time (TBT): Measures the time between First Contentful Paint and Time to Interactive (from when the first set of data is loaded until all data is fully loaded)
- Cumulative Layout Shift (CLS): Measures the stability of the page layout, which affects Google rankings, such as issues with shifting buttons, inconsistent text sizes, or excessively slanted text
- Time to First Byte (TTFB): Measures the time it takes for the user’s browser to receive the website’s content (the white page that appears when we click to change pages) to gauge the speed of the website’s response
Sometimes there may be other metrics that are appropriate or useful for us, but the metrics mentioned above are sufficient for getting started. See you in the next article.